- A push with an image outperforms text-only
- A CTA like “Claim Offer” works better than “Get Started”
- A short subject line gets more opens than a longer one
Plan availability
- Pro & Enterprise Plans: Up to 10 variants
- Free & Growth Plans: 2 variants
How A/B Testing works
A/B testing is only available when sending through the dashboard. It is not available with the API.To create A/B tests with Journeys, use Journey Split Branches.
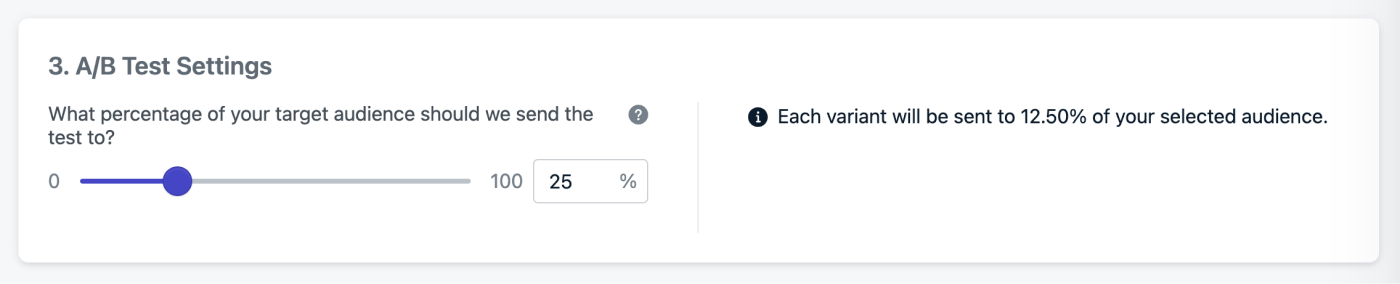
By default, 25% of your audience receives the A/B test. For valid results, each variant must receive enough users. The more variants you use, the larger your test group must be.If you set 100%, the message will be sent evenly to all users in the audience and eliminates the ability to send the “winner” to remaining users.
Select a Winner
Messages that are sent as A/B tests will be marked as such under the Messages Tab. Click into the report for each test to see the full report or view the variant-specific reports. We provide some statistics for you to view the performance and choose a winner. The below screenshot describes how to view different stats and select a winning variant. We will then send the winner variant to all the remaining members of your target audience.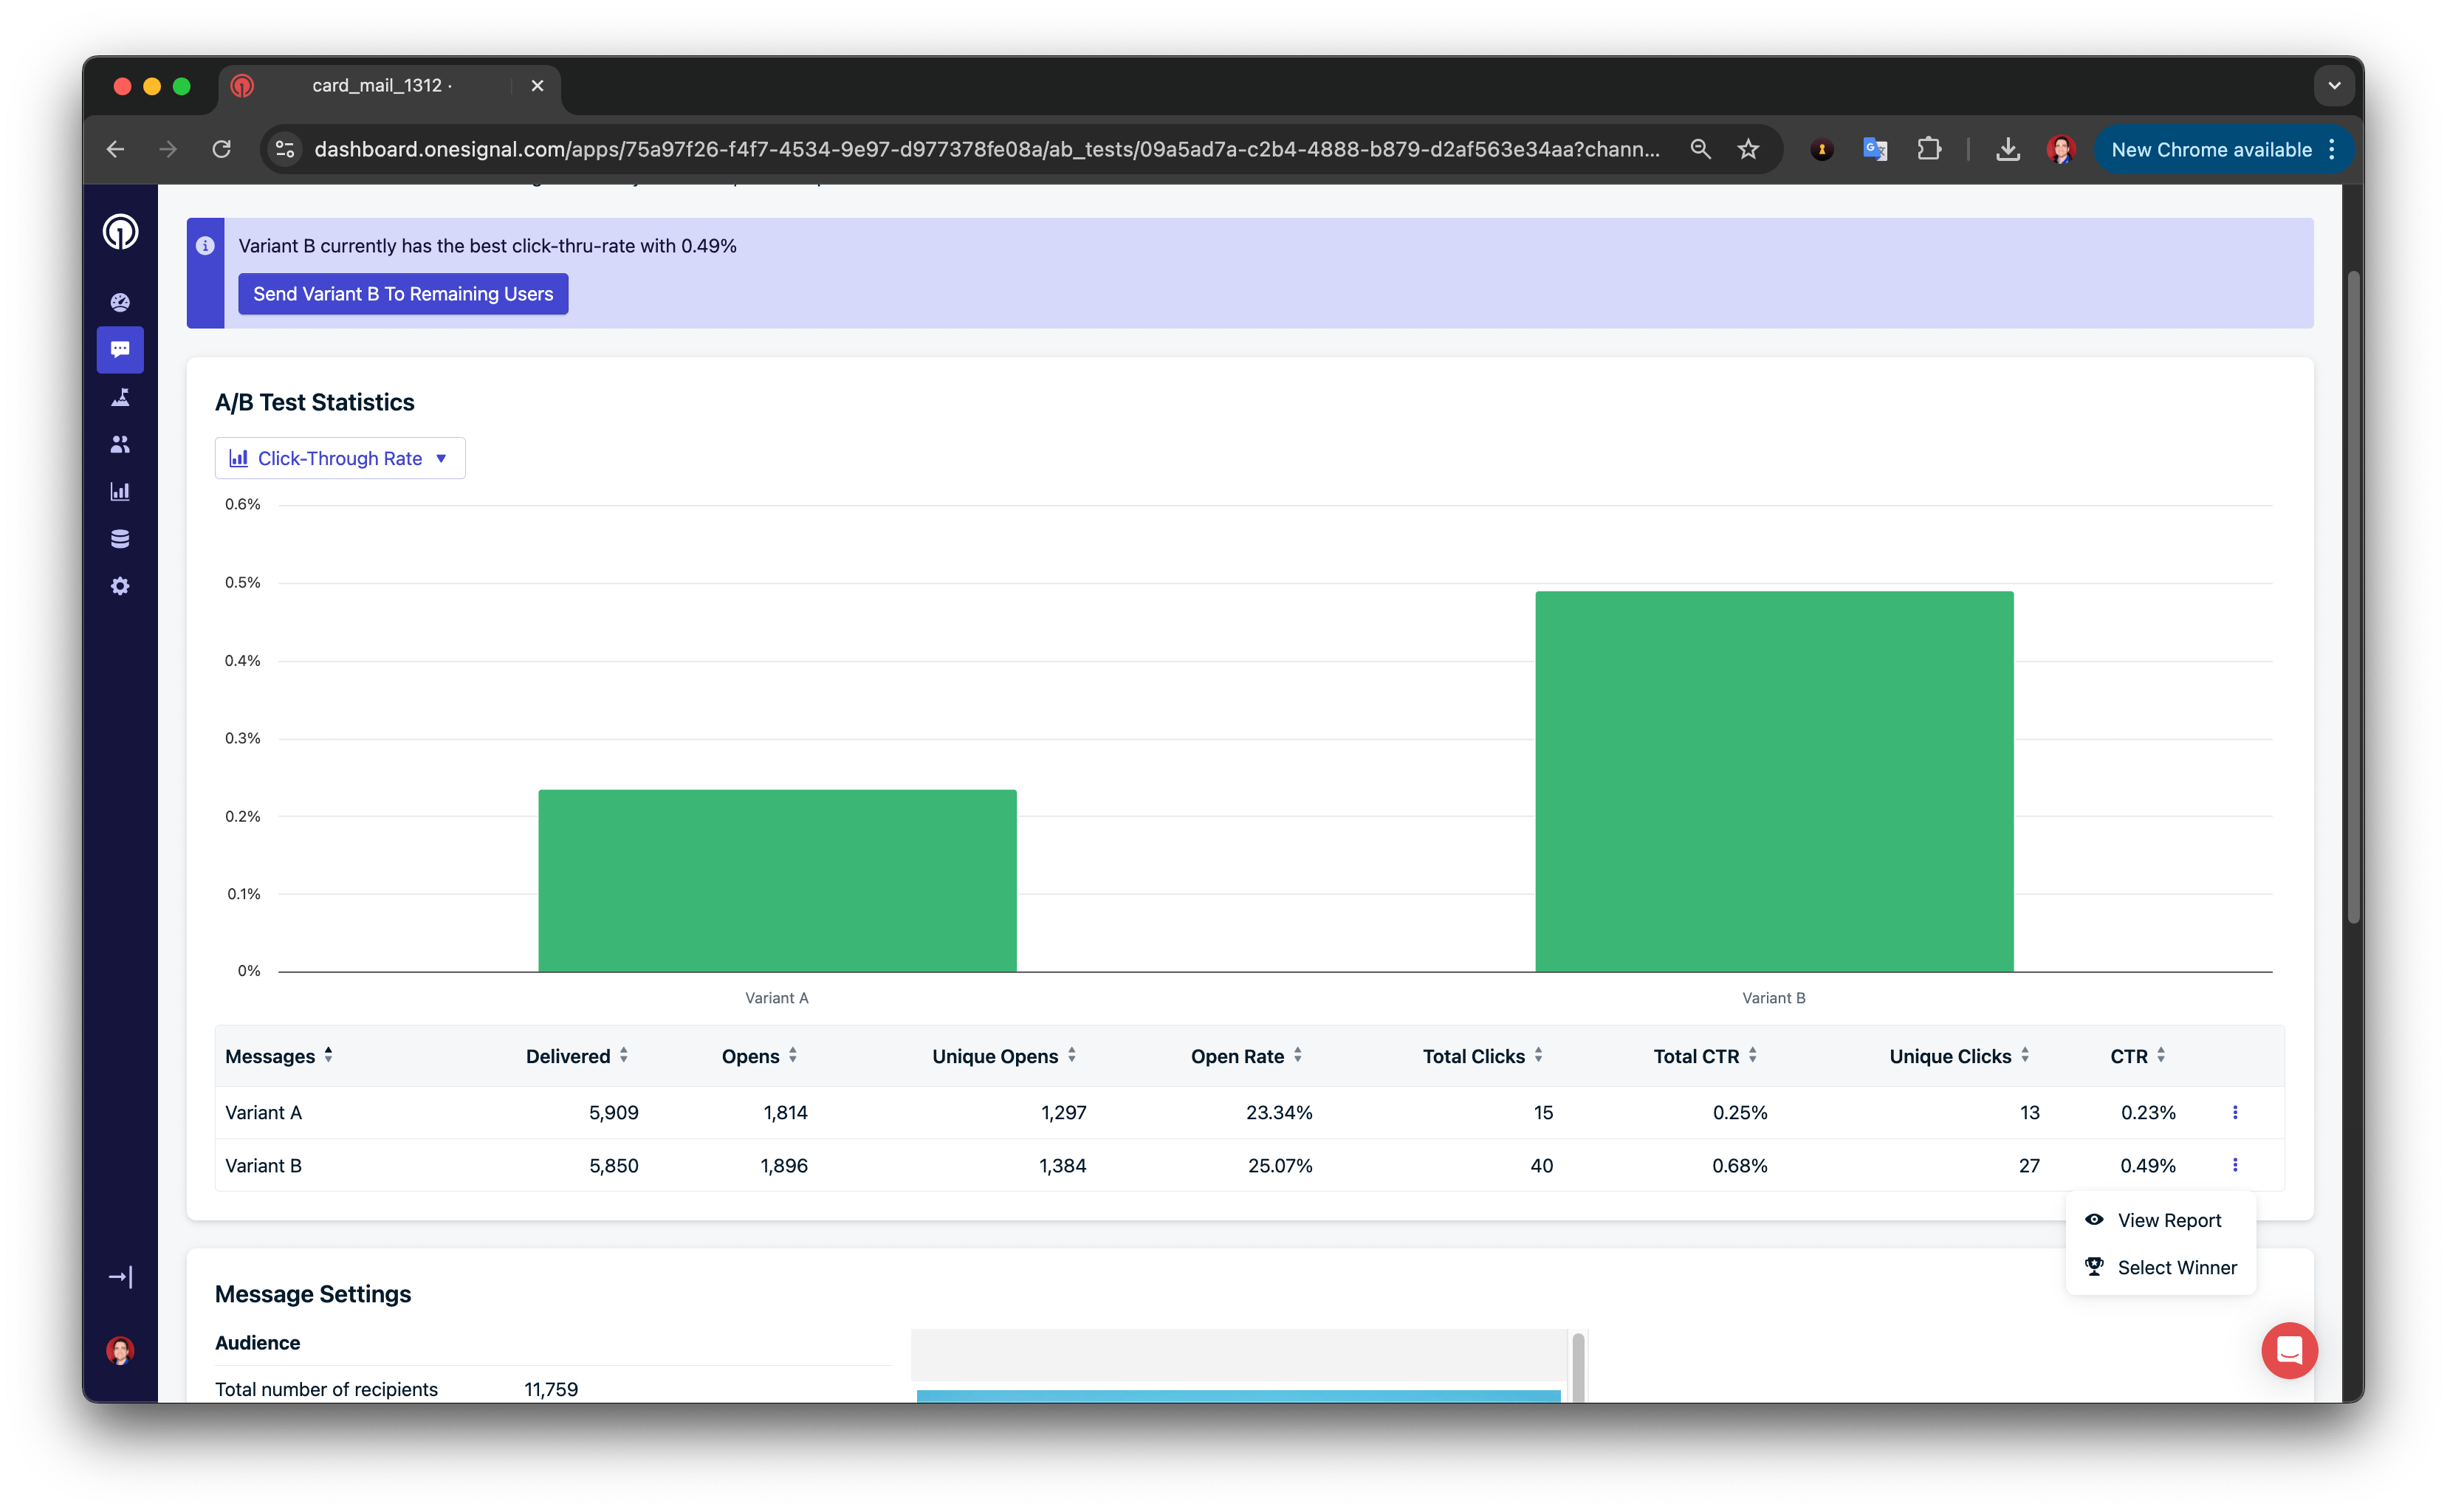
Platform-specific instructions
- Push A/B Testing
- Email A/B Testing
Create a Push A/B Test
- Go to Messages > Push > New Push
- Name your message (e.g., “Push AB Test - CTA Button”)
- Select your segment(s)
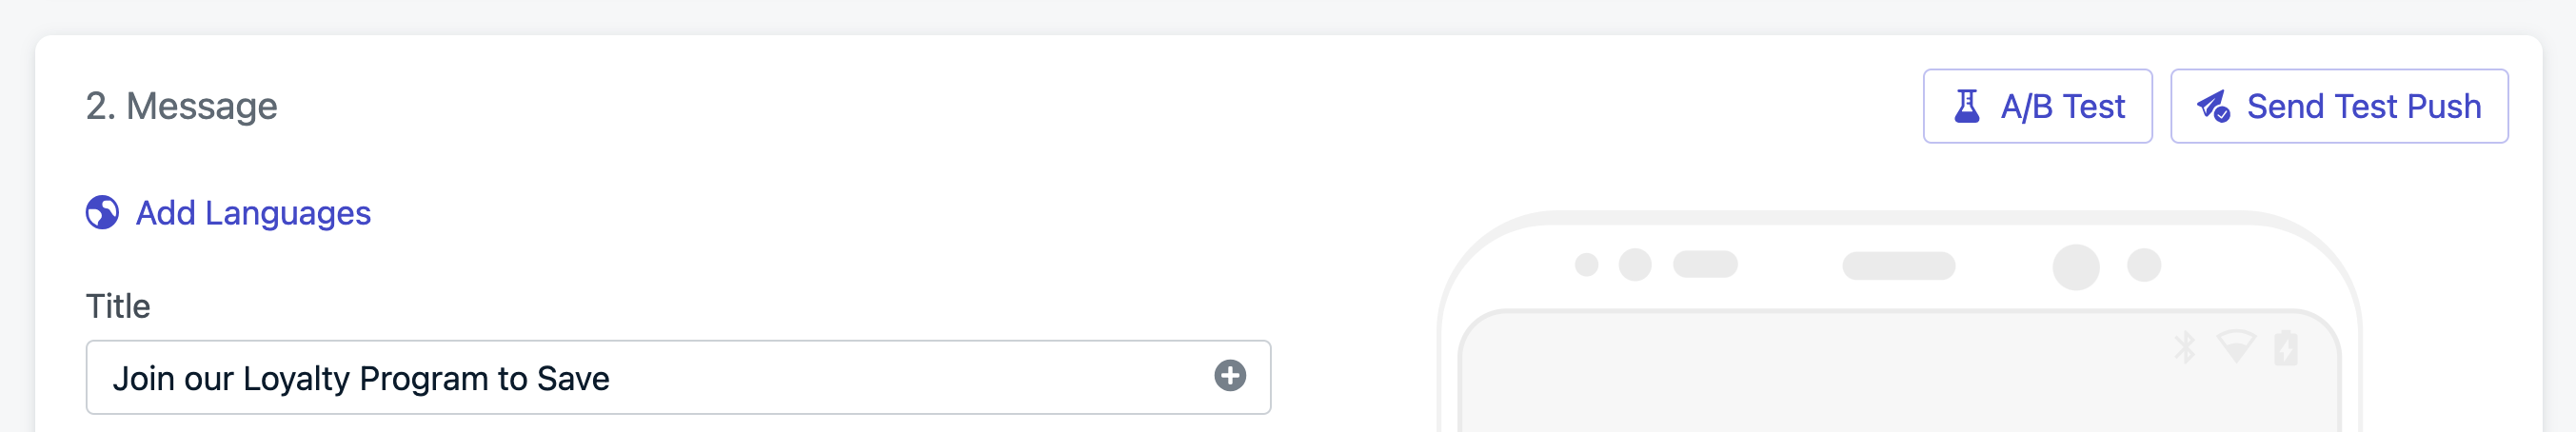
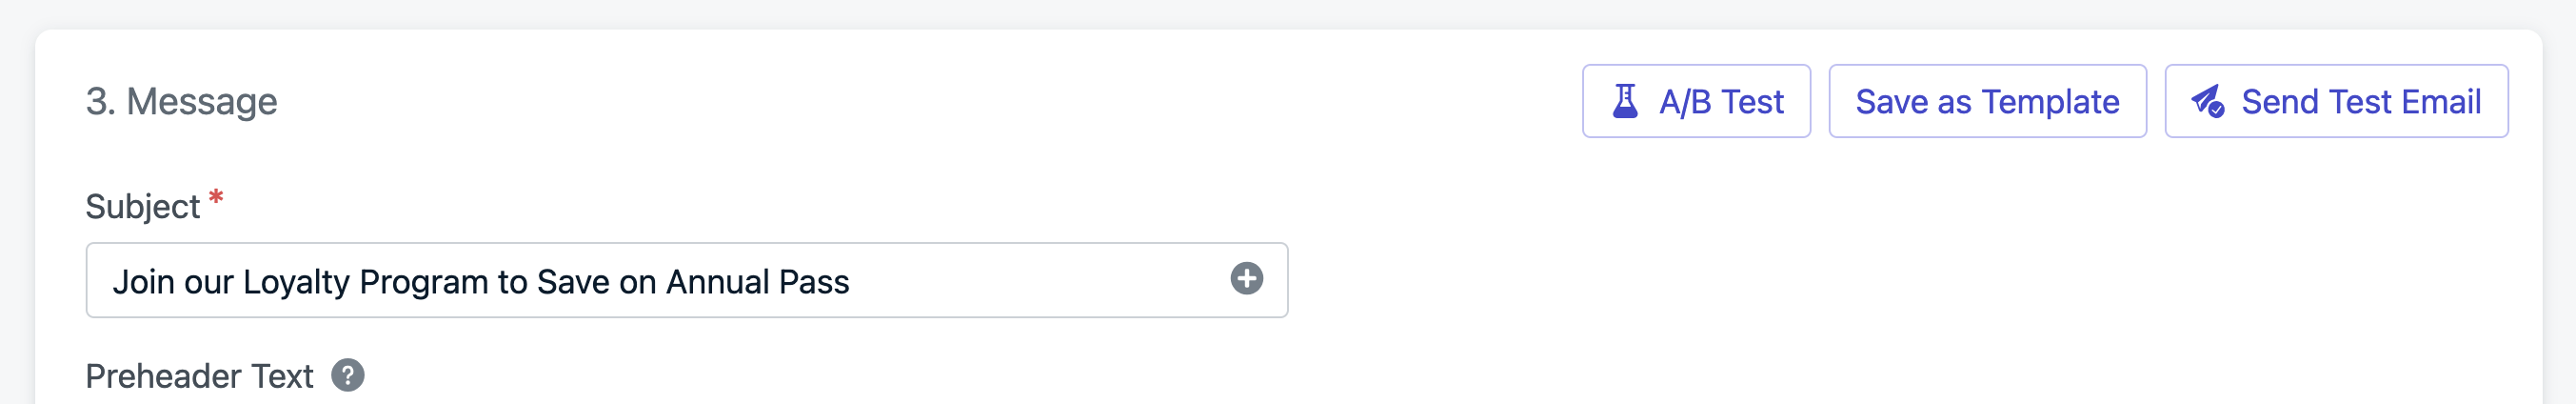
- Click the A/B Test button
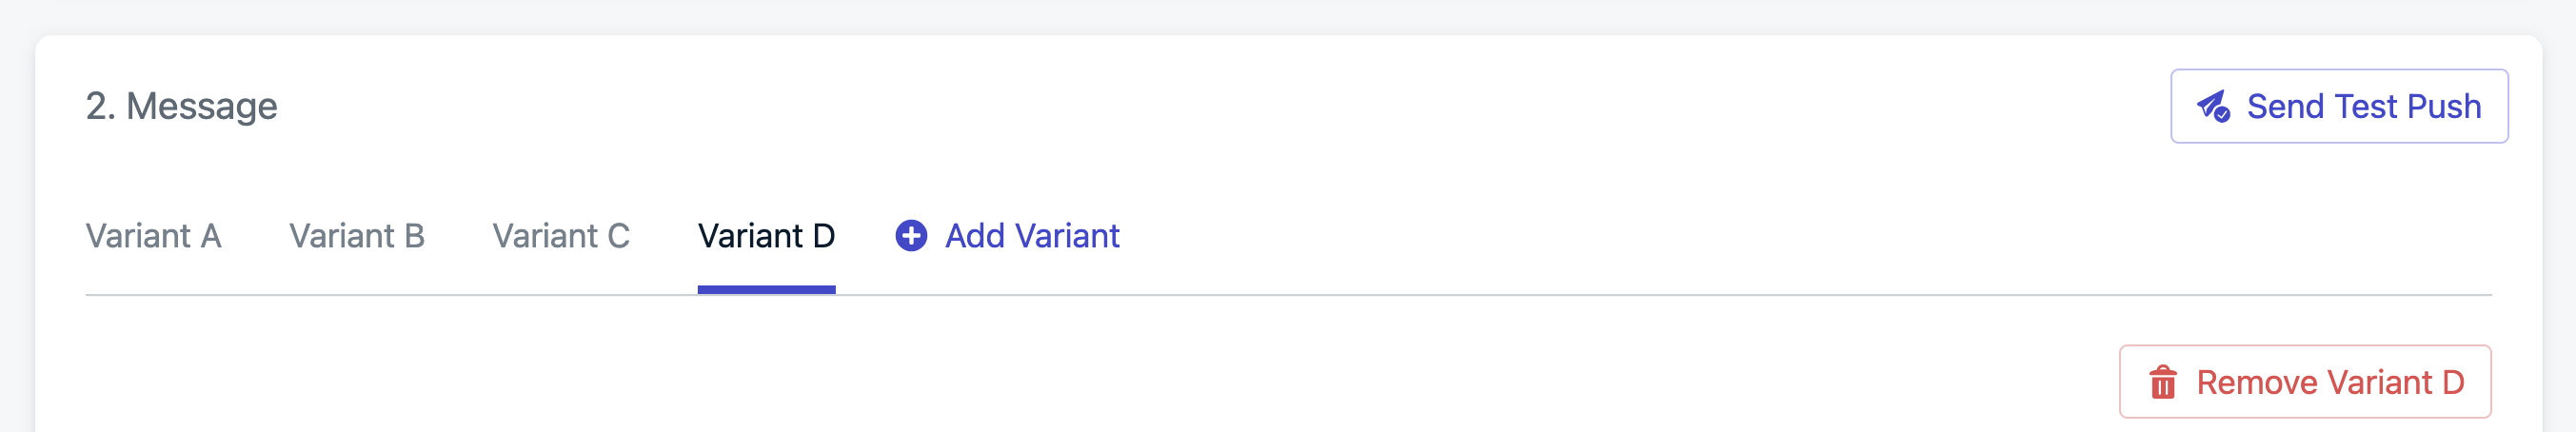
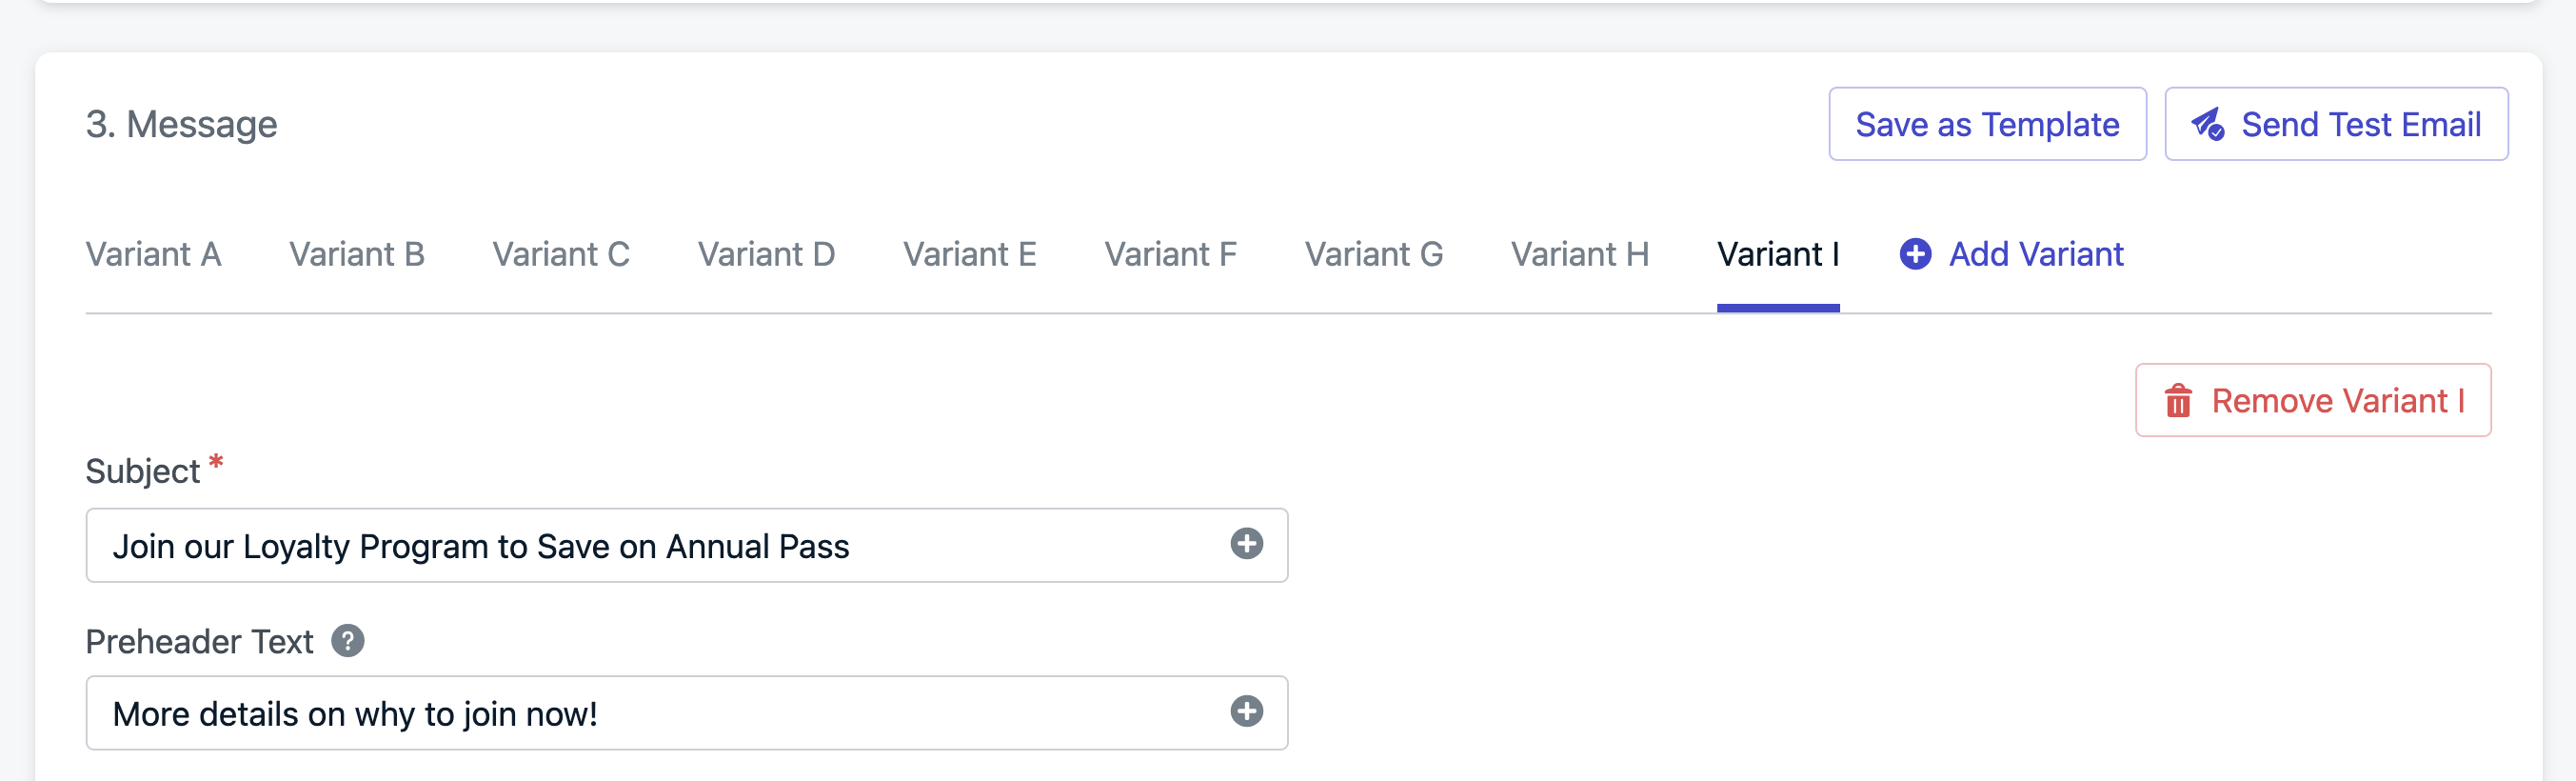
- Add variants
- Click Add Variant to duplicate and edit each new version.
- Only change one variable at a time for meaningful insights.
- A/B Test settings
- 25% of a message with 2 variants will sent 12.5% to each variant.
- 25% of a message with 10 variants will sent 2.5% to each variant.
- 50% of a message with 2 variants will sent 25% to each variant.
- 50% of a message with 3 variants will sent 16.67% to each variant.
- 100% of a message with 2 variants will sent 50% to each variant.
- 100% of a message with 4 variants will sent 25% to each variant.
- Review results
Best practices for A/B Testing
Understand benchmarks
Review past performance data so you can evaluate test success meaningfully.Set a goal and hypothesis
Clearly define what you’re testing and what success looks like.Change one variable at a time
Control your experiment by isolating variables like:- Subject lines
- Layouts
- CTA copy
- Length of copy
- Images
- Offers
- Emojis
- Colors
- Fonts
- Icons
- GIFs
Use controls
Include your “usual” version as a baseline for measuring improvements. Create control groups by tagging users randomly and exclude that segment. You can Export user data and create a segment from the CSV import.Test simultaneously
Send all variants at the same time to avoid timing bias.Continue testing
Iterate based on results to continuously optimize message performance.FAQ
Can I A/B test different segments?
Not within the standard message form. However, you can test different segments using Journeys with Split Branches and Yes/No Branches.Can I automatically select a winner?
Not yet. You must manually choose the winning variant or use 100% to send all variants.You’re done! You can now test different variants of your messages and select a winner.
Need help?Chat with our Support team or email
support@onesignal.comPlease include:- Details of the issue you’re experiencing and steps to reproduce if available
- Your OneSignal App ID
- The External ID or Subscription ID if applicable
- The URL to the message you tested in the OneSignal Dashboard if applicable
- Any relevant logs or error messages