These analytics are available for Journeys set live after December 13, 2023.
Not seeing message reports for an existing Journey? Duplicate and re-launch the Journey to enable deeper insights.
Users vs. Subscriptions: Journey-level metrics are based on Users, while message-level metrics are based on Subscriptions (e.g., devices, emails, phone numbers). Users may have multiple Subscriptions across channels.
Journey report
To view a report of the entire Journey, open the Journey and click Journey Report at the top. This report shows how your Journey performs over time and provides a high-level view of trends and success metrics. Metrics are based on the number of users moving through the Journey.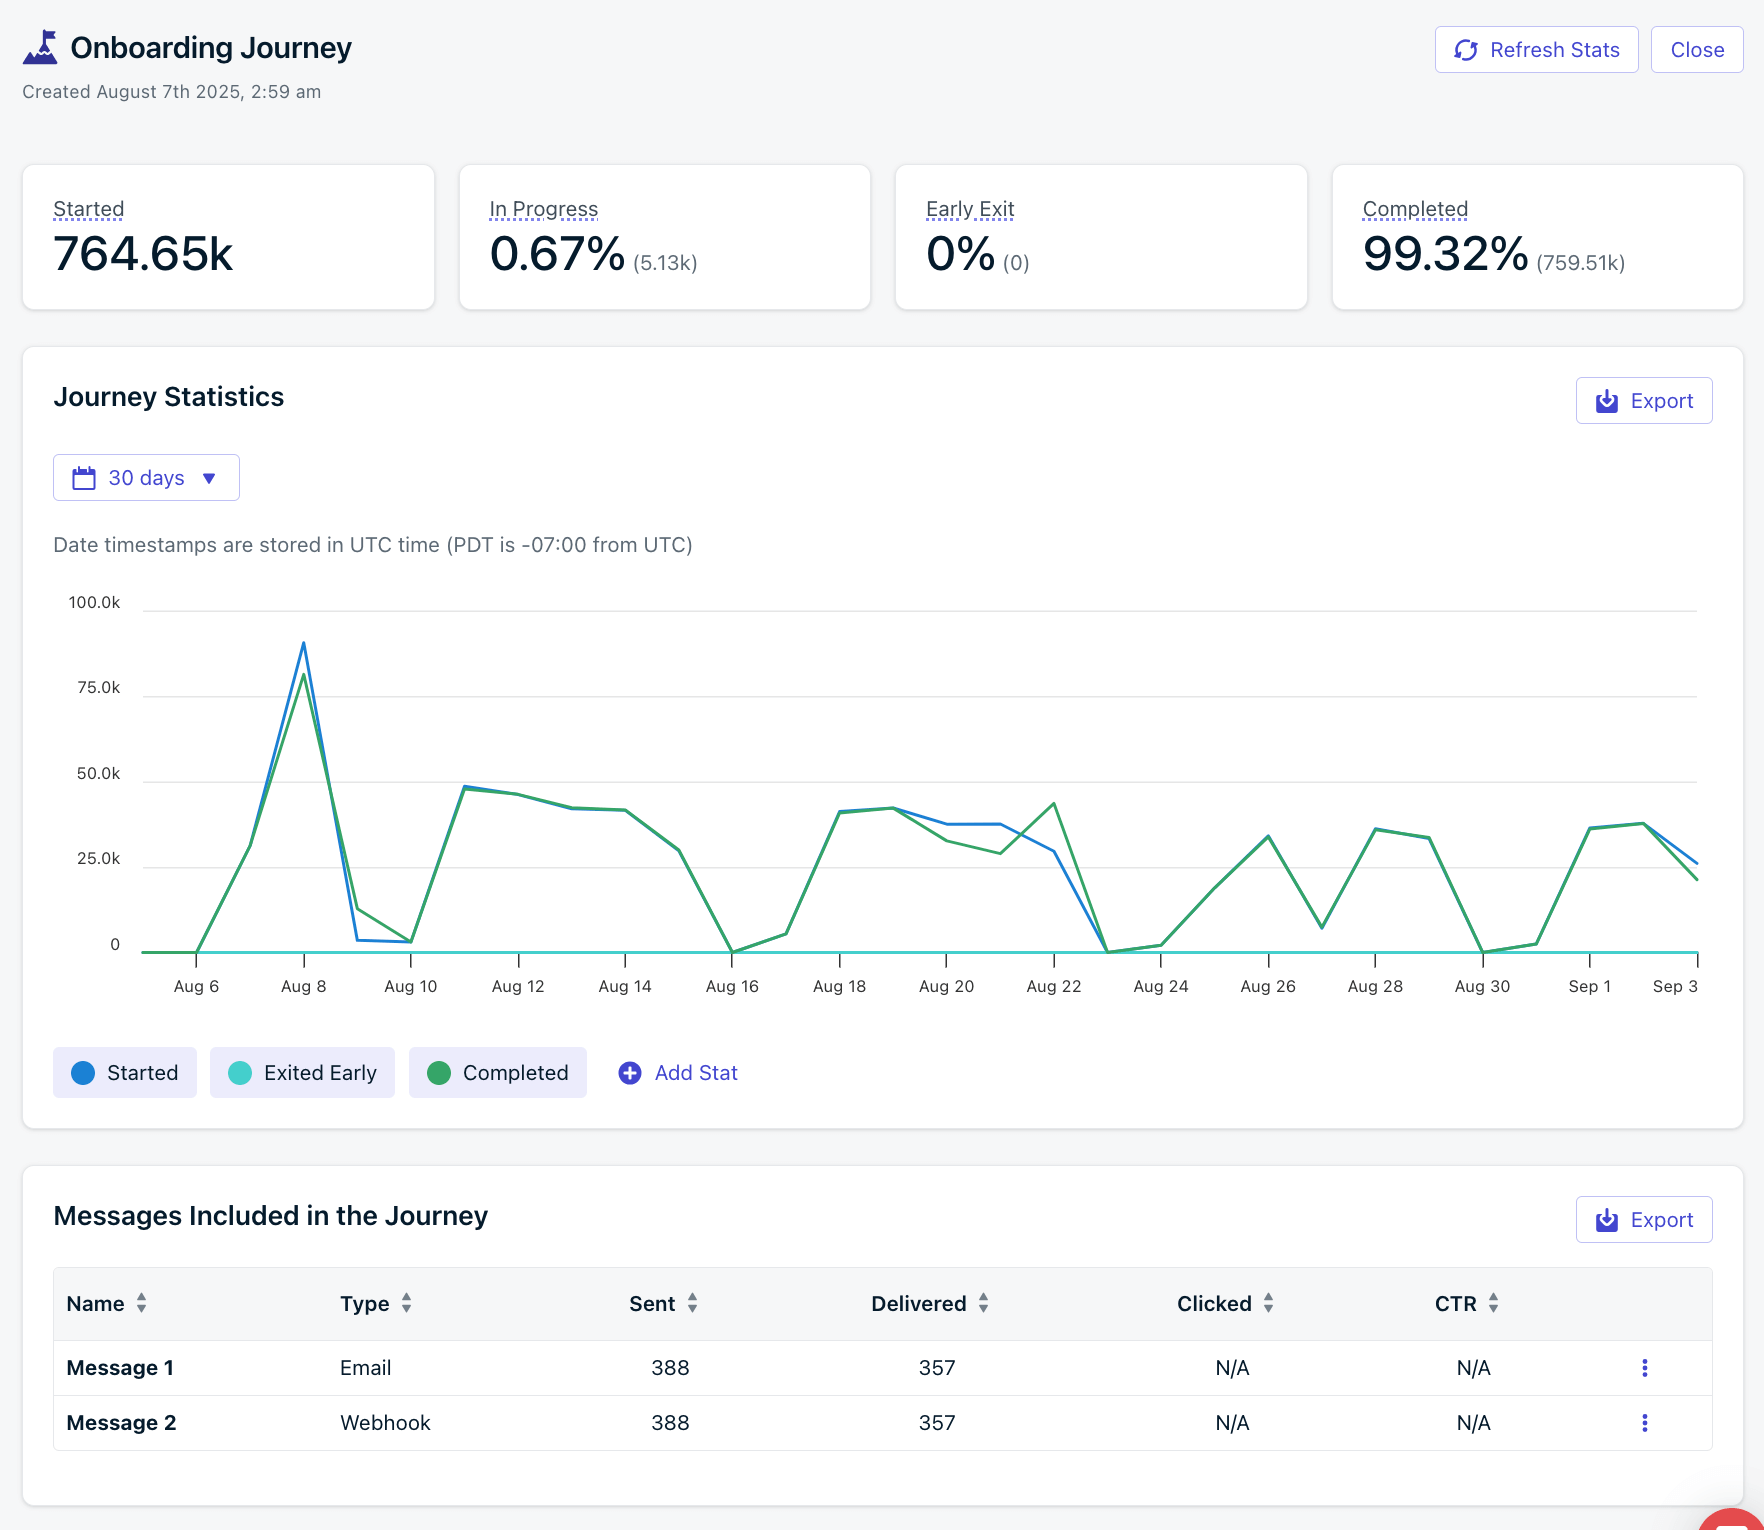
Journey report showing entry and exit stats, and included messages' stats.
Journey stats
High-level stats for the entire Journey. This data is available for the lifetime of the Journey. However, the graph and each message’s Audience Activity are only available for 30 days.| Metric | Description |
|---|---|
| Started | Total number of Users that started this Journey. Includes re-entries; a User who re-enters the Journey will increment this count again. |
| In Progress | Users currently in the Journey. |
| Early Exit | Users who exited due to an exit rule. Calculated as (early exits / total started) * 100. Useful for tracking conversions such as upgrade segment entry. |
| Completed | Users who completed all Journey steps. Calculated as (completed exits / total started) * 100. |
Journey step stats
When looking at each step or node of the Journey, you can see high-level stats that are available for the lifetime of the Journey. This data is available for the lifetime of the Journey.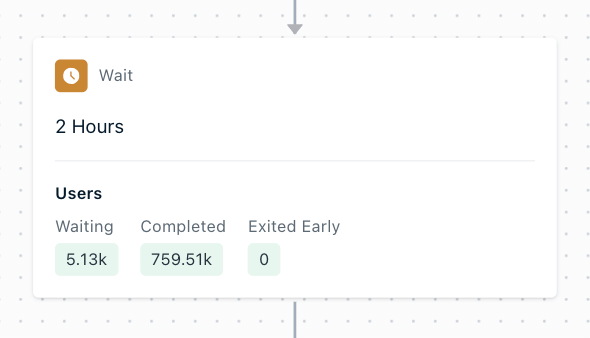
Journey step stats. Example Wait Node.
| Metric | Description |
|---|---|
| Waiting | Users currently waiting in this step. For message steps, this is usually 0 as messages are sent immediately. |
| Completed | Users who completed this step and moved forward. For the last Exit step, this shows total completions of the entire Journey. |
| Exited Early | Users who exited due to an exit rule. For the last Exit step, this represents all early exits across the Journey. Helps track conversions tied to exit criteria like segment entry. |
Push stats
High-level stats for the push message step. This data is available for the lifetime of the Journey. Click into the step to see more detailed message reports.| Metric | Description |
|---|---|
| Sent | Messages attempted to be sent to subscribed devices. May be limited by frequency capping, unsubscribed users, or missing push permissions. |
| Delivered | Messages successfully sent to the push provider (e.g., APNs or FCM). |
| Confirmed | Messages confirmed as received by the user’s device. |
| Clicked | Total user clicks on the message. |
| CTR | Click-Through Rate = (Unique Clicks / Deliveries) * 100. |
| Failed | Messages that failed to send. |
| Unsubscribed | Devices that unsubscribed from push after receiving the message. |
| Capped | Messages not sent due to frequency capping. |
In-app message stats
High-level stats for the in-app message step. This data is available for the lifetime of the Journey. Click into the step to see more detailed message reports.| Metric | Description |
|---|---|
| Impressions | Number of times the in-app card was displayed. |
| Clicked | Number of times an interactive block was clicked. |
| CTR | Click-Through Rate = (Unique Clicks / Displays) * 100. |
Email stats
High-level stats for the email message step. This data is available for the lifetime of the Journey. Click into the step to see more detailed message reports.| Metric | Description |
|---|---|
| Sent | Emails attempted to be sent. May be blocked by unsubscribed users or list errors. For diagnostics, check the Delivery page. |
| Delivered | Emails confirmed as successfully delivered to inboxes. |
| Opens | Unique opens. May be affected by privacy protections. See Why are Open events low?. |
| Clicks | Total number of link clicks (not unique). |
| CTR | Click-Through Rate = (Unique Clicks / Deliveries) * 100. |
| CTOR | Click-to-Open Rate = (Unique Clicks / Unique Opens) * 100. |
| Bounced | Messages that failed due to invalid addresses, domain issues, or spam reputation. Bounced addresses are added to the Suppression List. See How to improve email deliverability. |
| Failed | Emails that OneSignal could not deliver and dropped. See Why are emails marked as failed?. |
| Spam | Recipients who marked your email as spam. These are added to the Suppression List. |
| Suppressed | Emails not sent due to prior bounces or spam reports. Helps protect your sender reputation. (Available only for OneSignal Email). |
| Unsubscribed | Users who opted out via the unsubscribe link. Their subscription status is updated immediately. |
SMS stats
High-level stats for the SMS message step. Click into the step to see more detailed message reports.| Metric | Description |
|---|---|
| Sent | Messages OneSignal attempted to send to SMS subscribers. |
| Delivered | Messages successfully delivered. |
| Failed | Messages that failed to send. |
Journey message reports
Within the Journey editor, click a message step to open its delivery report. These message-level reports are based on the number of Subscriptions that were sent the message. For example, if 1 user entered the Journey and had 2 subscribed Subscriptions for the message channel (push, email, etc.), then 2 messages will be sent (one for each Subscription). Top-level stats are for the lifetime of the message. For details on each metric, see: Graph data and Audience Activity are only available for 30 days. This data is also available in Template Analytics.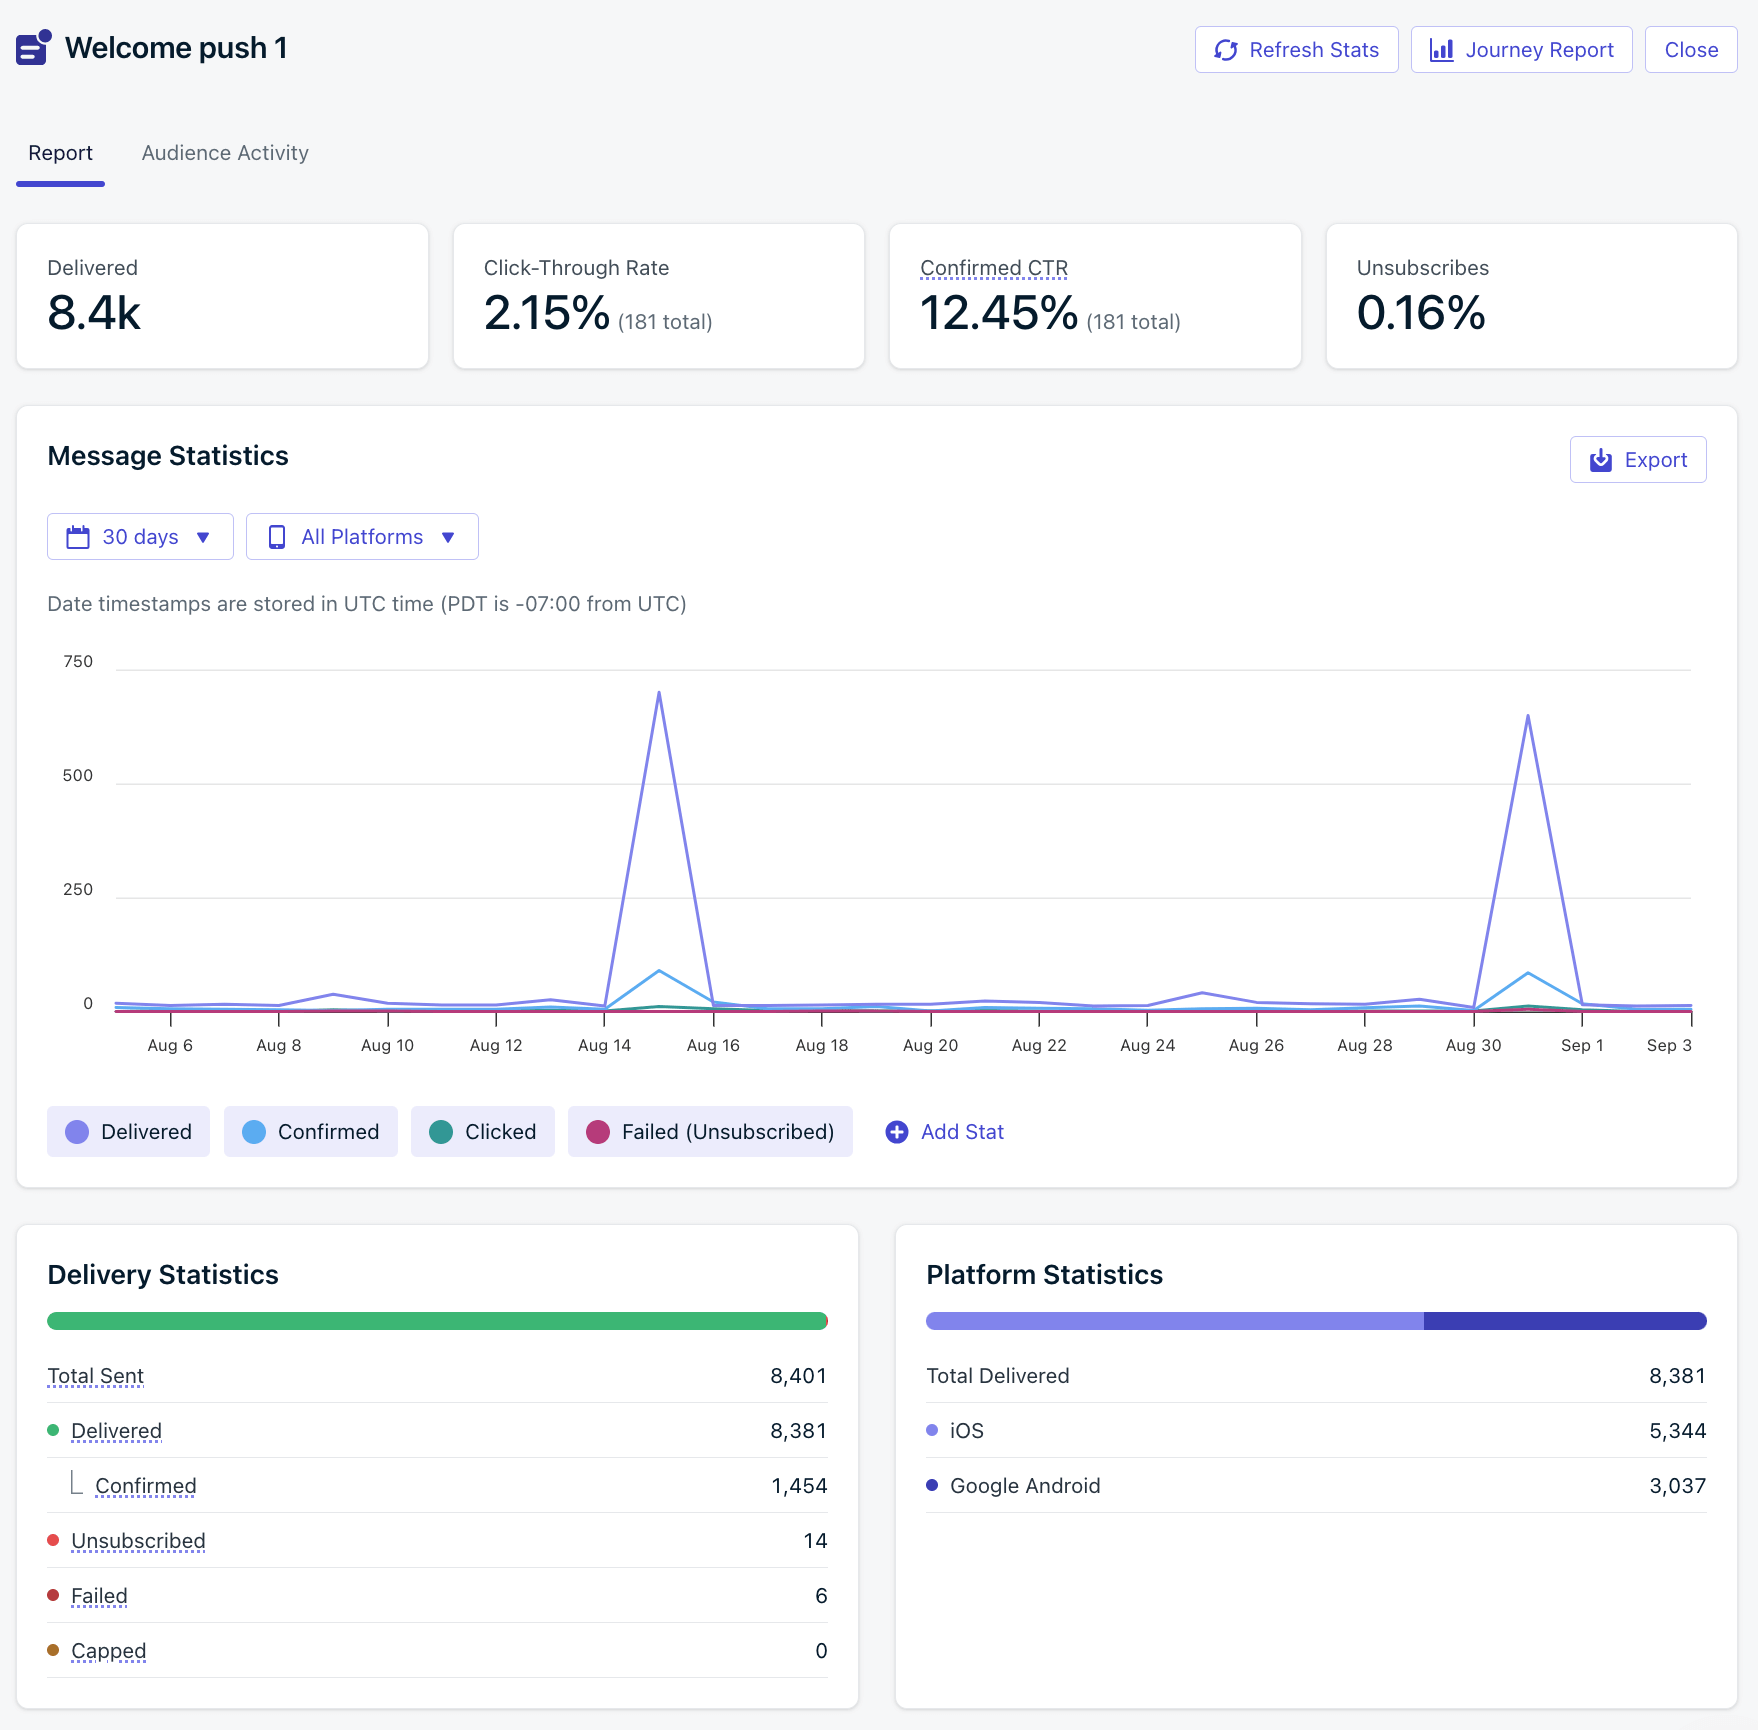
A message report showing a push notification's delivery stats
Audience activity
The Audience Activity section shows the users who were sent a message. You can export the full list of users for a given message step by clicking Export. This data is available for 30 days.Each user appears only once per tab. If a user re-enters and receives the same message multiple times, they will only appear once in the export for that step.
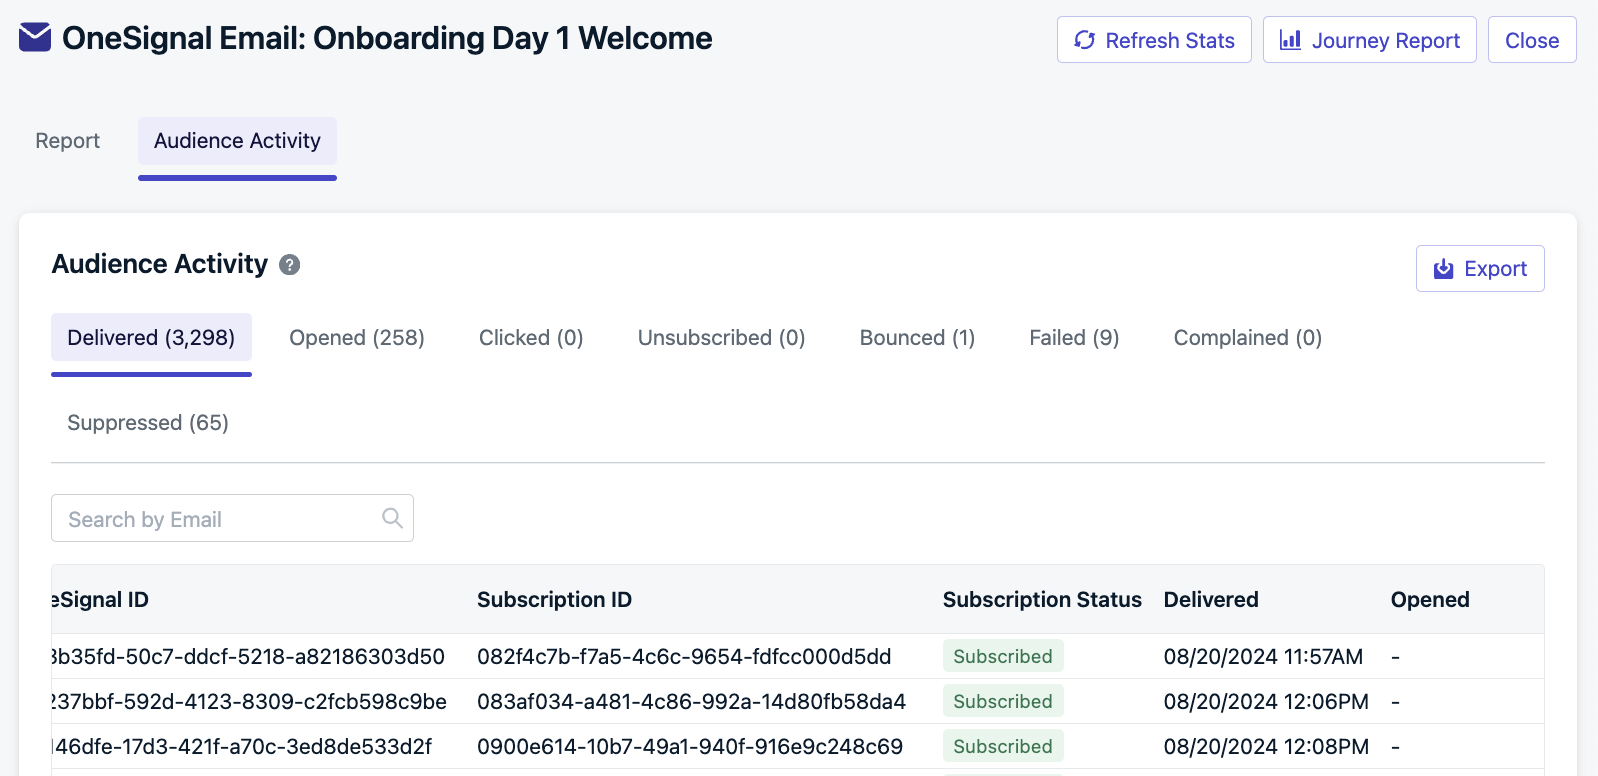
Audience activity report