Overview
OneSignal provides detailed error messages in your browser’s Developer Tools Console when your site has the Web SDK active. Before troubleshooting, double-check the Web SDK Setup to ensure:- The OneSignal JavaScript snippet is placed in your site’s
<head>. - The service worker files are properly placed at the root and accessible via HTTPS.
Initial troubleshooting steps
Test in a clean browser profile
- Use the latest version of Chrome or Firefox.
- Push does not work in incognito/private/guest modes.
- Check the supported browsers list.
Open browser developer tools
Attempt to subscribe and observe errors
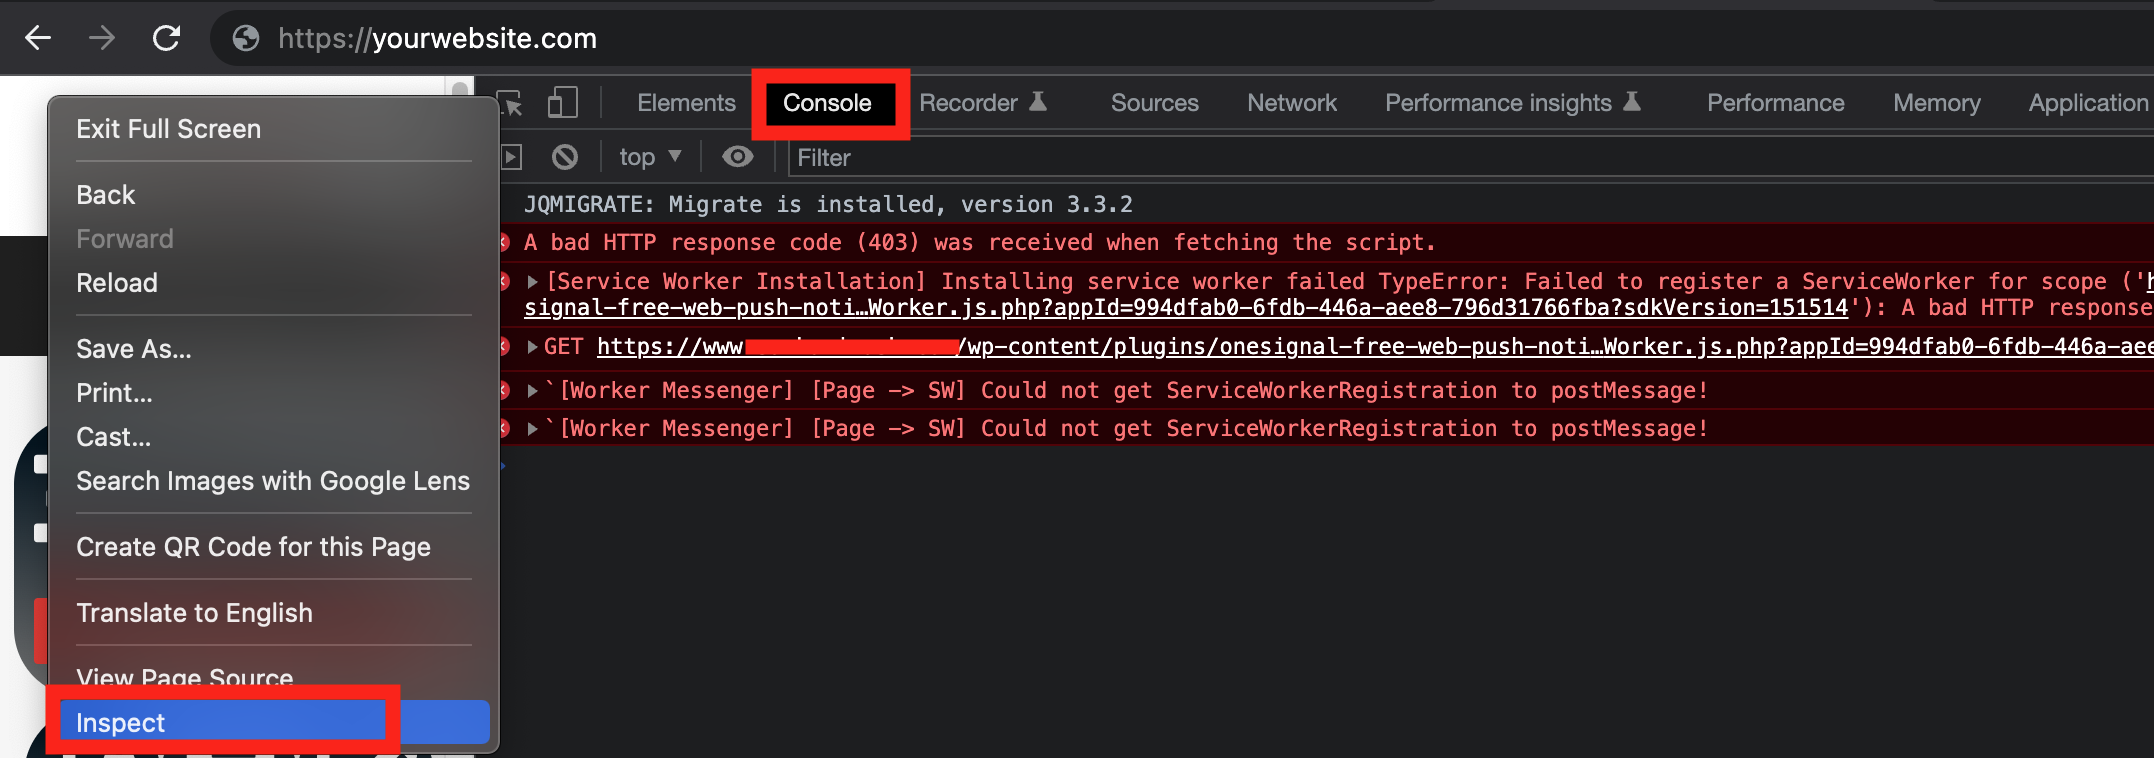
Open your browser's developer tools and inspect for errors
Common error messages and solutions
Service worker errors (403, 404)
https://www.yoursite.com/’) with script (‘https://www.yoursite.com/...’): A bad HTTP response code (403) was received when fetching the script.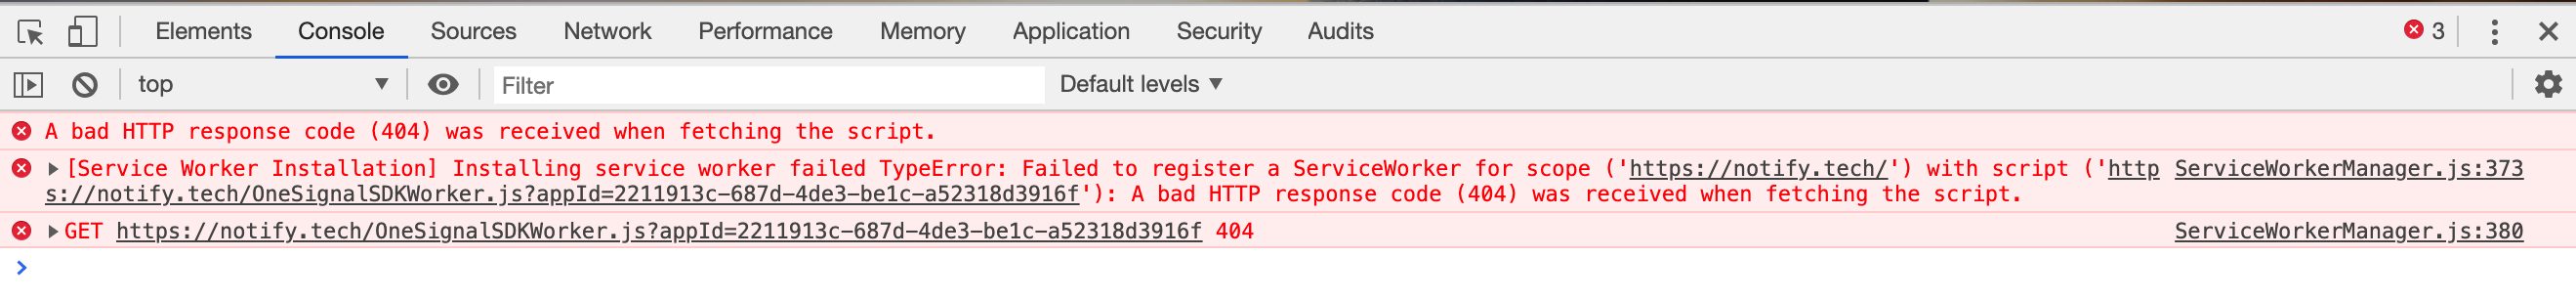
Example of a service worker installation error
- Confirm file availability
- Visit the service worker file URL in the browser. You can find the path in the OneSignal dashboard Settings > Push & In-app > Web.
- Example paths:
https://yoursite.com/OneSignalSDKWorker.jshttps://yoursite.com/push/onesignal/OneSignalSDKWorker.js
- If using WordPress the path is:
https://yoursite.com/wp-content/plugins/onesignal-free-web-push-notifications/sdk_files/OneSignalSDKWorker.js
- If these return a 403/404 or redirect, your push setup will not work.
- File names are case-sensitive and must be publicly accessible.
Unsupported MIME type
- Your service worker must be served as
application/javascript. - Serving the file with another MIME type (e.g. text/html) will cause registration to fail.

MIME type error in service worker
Redirects are not allowed
- OneSignal SDK files must not redirect.
- They must be hosted on the same origin as your site (no CDN or proxy domains).

Redirect error in console
Web Push config can only be used on correct site origin
- Your current domain doesn’t match the site URL configured in the OneSignal dashboard.
- Protocol, domain, and subdomain must match exactly.

Site origin mismatch error
OneSignal is already defined
- The SDK is initialized more than once, often caused by combining WordPress plugin setup with manual code.
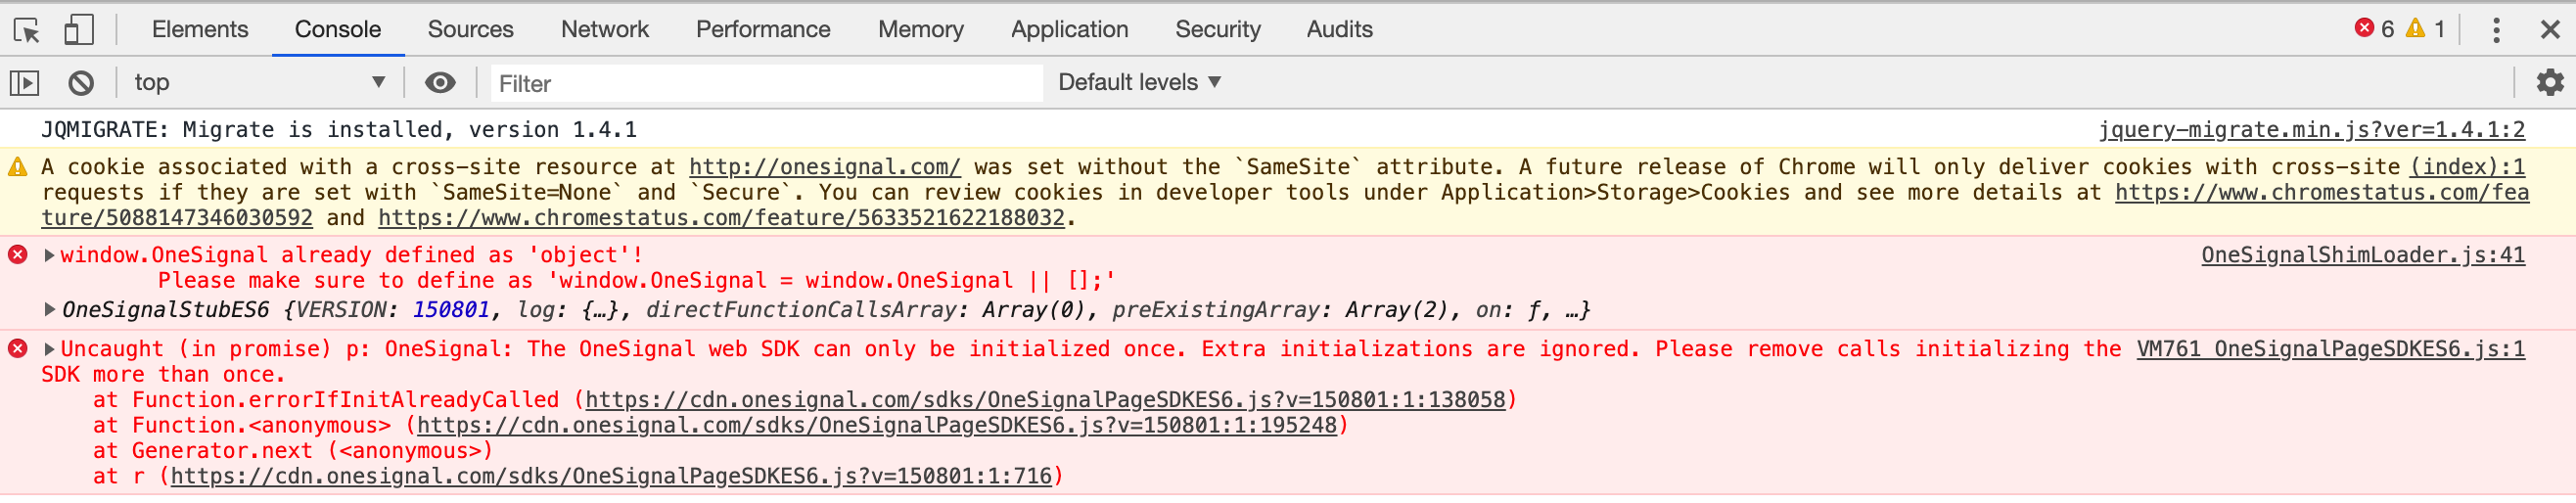
Duplicate SDK initialization error
Mobile web push troubleshooting
iOS - See Safari Web Push on iOS for requirements. Android - Web push works automatically on android mobile devices using a supported browser.- First make sure your site works on Desktop before testing on mobile.
- You may be subscribed on Android web already, but our dashboard does not differentiate mobile web subscribers from desktop web subscribers. An Android web subscriber shows as
Linux armv8lin the Device column of the “Subscriptions” page. - Check if Notifications are enabled on the browser app. For example, on Chrome in your Android Settings > Application Manager > Chrome. Make sure “Show notifications” is checked.
- Clear your Cache. If your browser cache is full on mobile, this may not allow further prompting or subscription.
- Some users reported that uninstalling and re-installing the browser app fixed an issue where the prompt would not show.
Safari Troubleshooting
-
The Site URL set in the Safari Config must be exactly what you see when visiting the site. For example, if you see
https://www.yoursite.comin the browser, then you must add this to the setup field. www and non-www sites are different origins. - Safari 12.1+ created a new rule that users must perform some action on the site before they can get prompted
- Finally, try Clearing your cache and resetting push permissions to see your site as a first time user and try to subscribe again.
Safari icons or site name not changing
Due to Safari’s custom web push implementation, your site name and icon image are treated as static resources downloaded and stored locally on the user’s computer. New site names and new images are not updated or downloaded. Unfortunately anyone subscribed with these older resources will need to clear your cache and resetting push permissions and return to the site to resubscribe.Clearing your cache and resetting push permissions
See Clearing your cache and resetting push permissions for more details.Debugging using Browser Developer Tools
The browser’s developer tools can be used to interact with the web SDK on your webpage and enable logging or easily send test notifications to yourself.Access the Browser Developer Tools Console
Accessing the developer console
- Chrome: Right click on the page, click Inspect, and click the Console tab of the popup window that opens up.
- Firefox: Right click on the page, click Inspect element, and click the Console tab of the popup window that opens up.
- Safari: Go to Safari → Preferences → Advanced and make sure Show Develop menu in menu bar is checked. Then, on your webpage, right click, click Inspect element, and click the Console tab of the popup window that opens up.
- Chrome on Android: Enable USB Debugging, connect your device into your computer and access the Dev Tools with
chrome://inspect#devicesin your Desktop Chrome browser. - Firefox on Android: Enable USB Debugging, connect your device into your computer and access the Dev Tools with
about:debuggingin your Desktop Firefox browser.
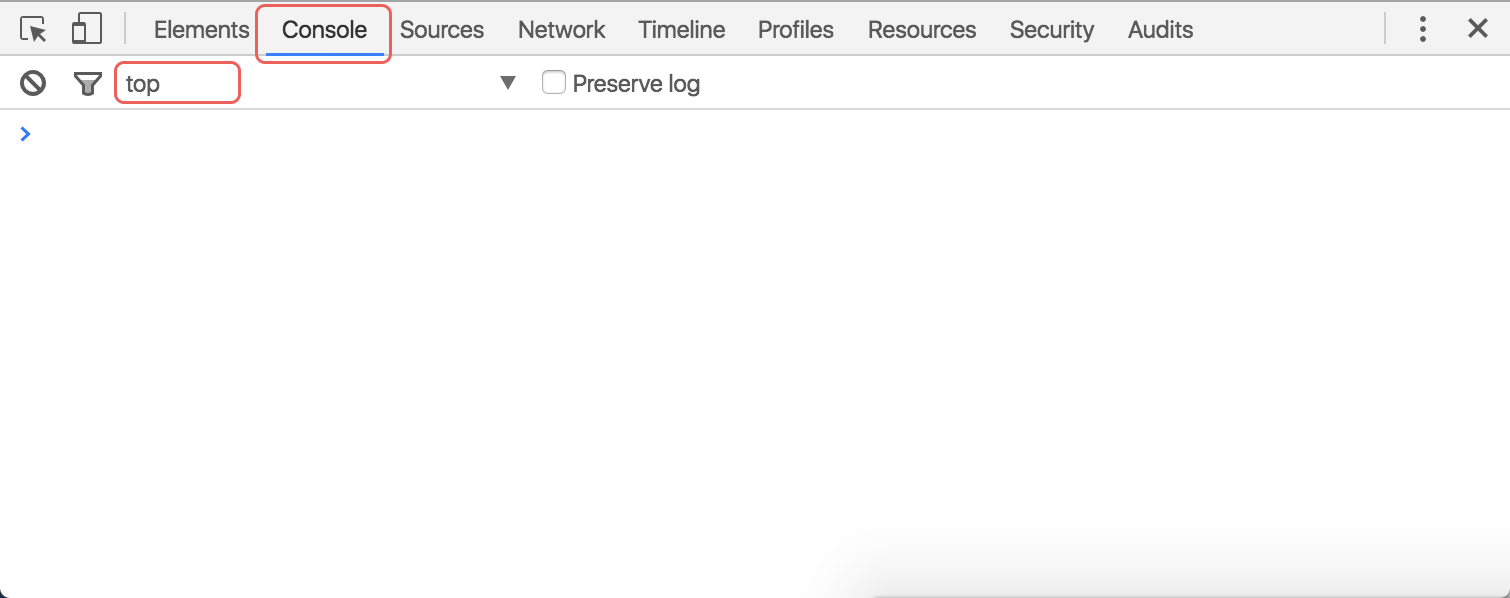
Enable web SDK logging
undefined as the result.If you see:top frame context (see above screenshot).Now that our web SDK’s debug logging is enabled, please close the tab and open a new tab to the same page (refreshing the page is not enough to trigger some of our SDK events). You should see a lot of output in the Console.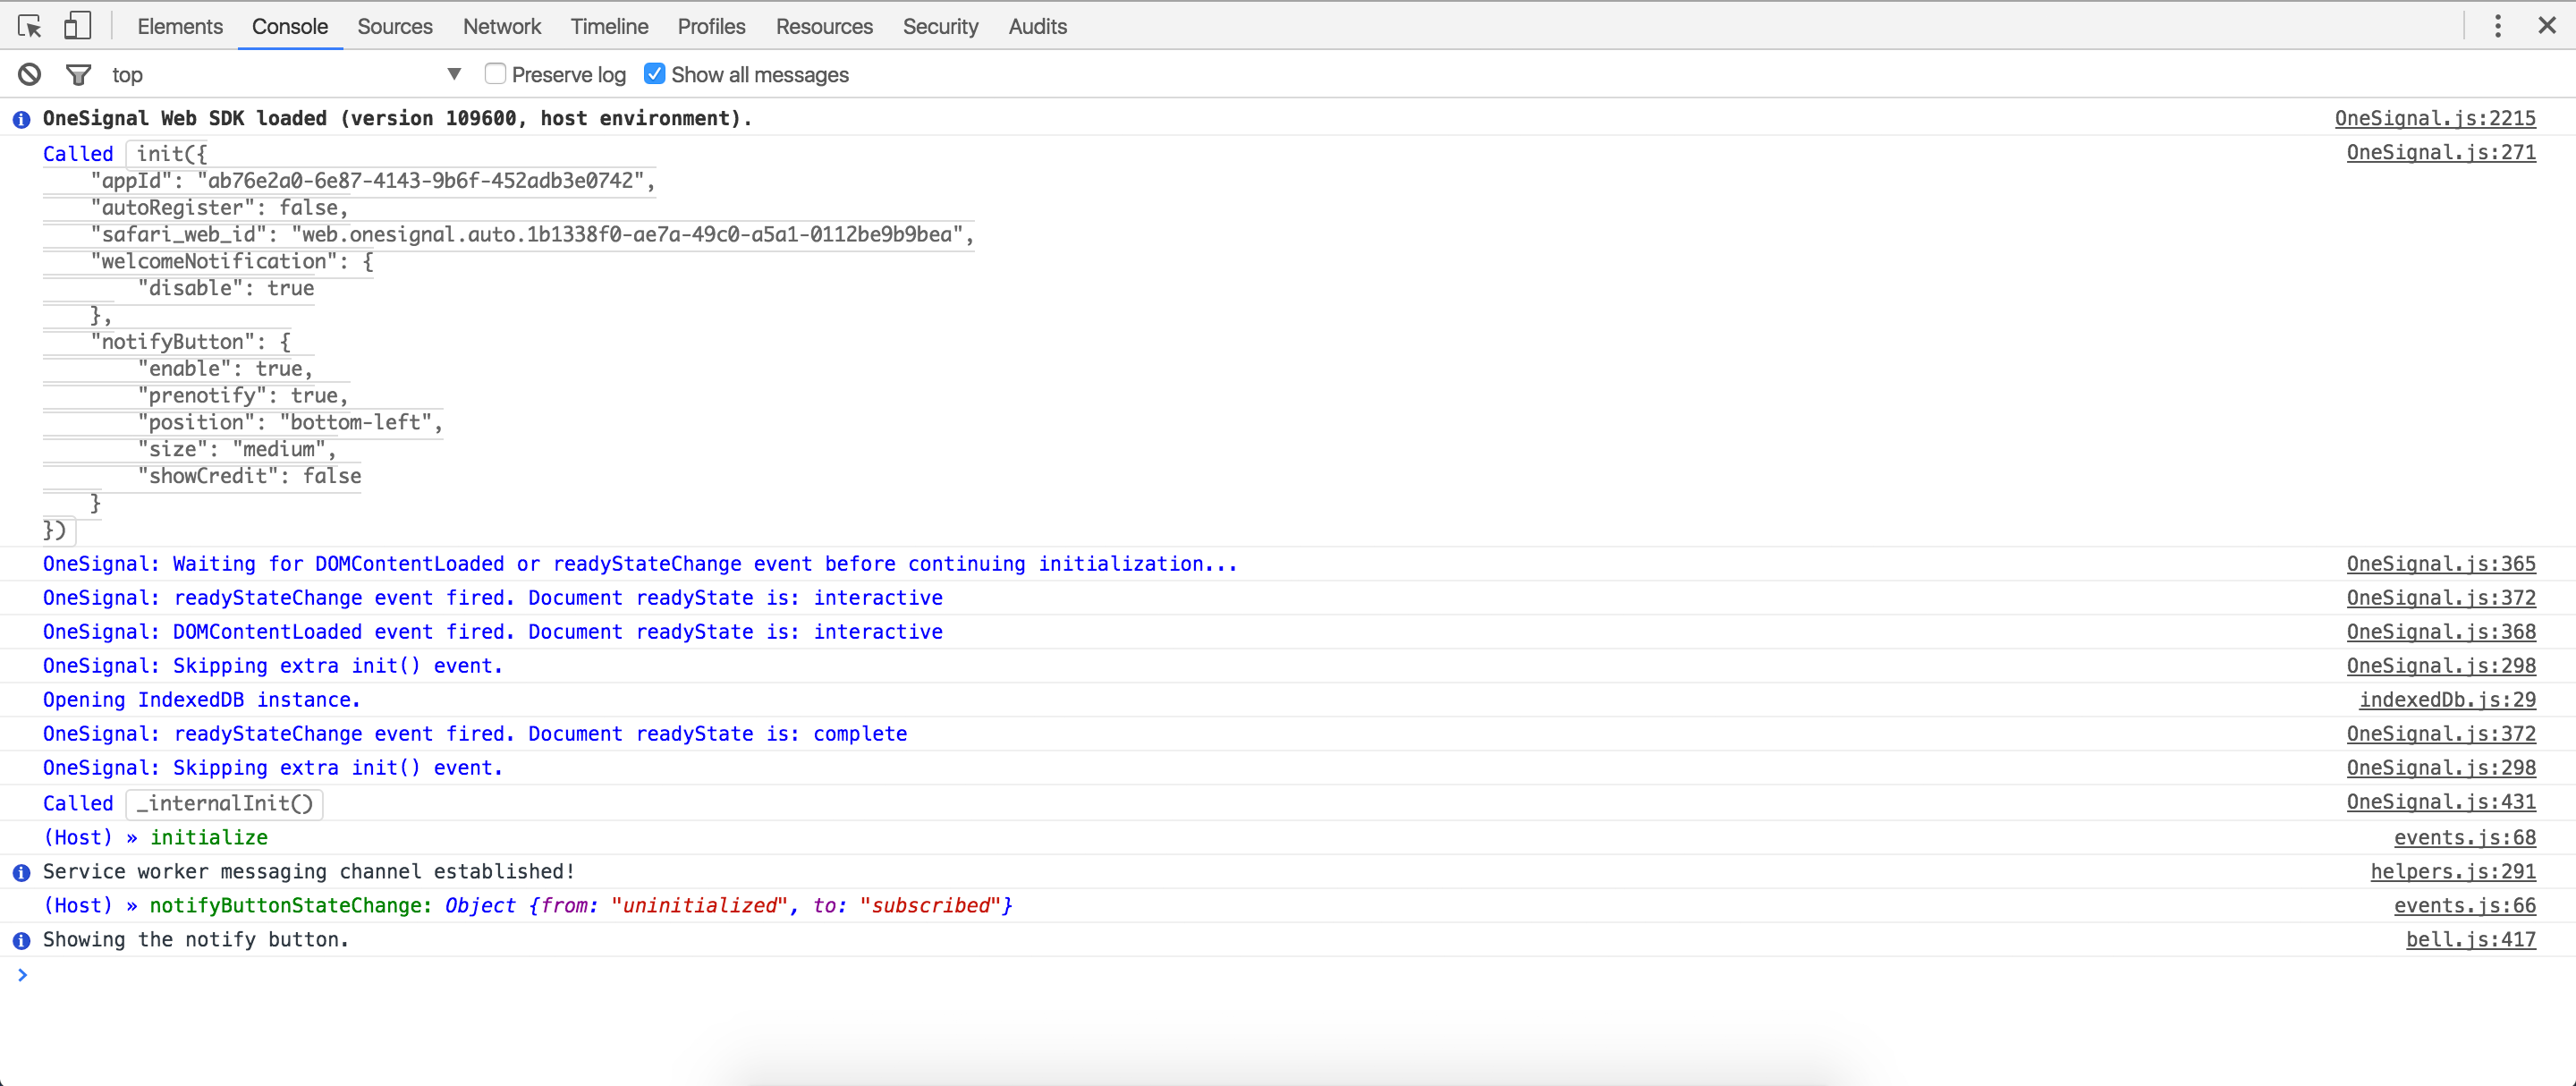
Console with verbose SDK logs
Check if you are subscribed
Send yourself a test notification
- Make sure you aren’t blocking notifications at the operating system level.
- See Notifications Not Shown: Web Push.
Debugging not receiving Chrome notifications
Note: Please complete these steps in order.Follow steps 1 - 4 above to try receiving a test notification
- For step #3, are you subscribed? If not, stop here, completely clear your site data following these specific instructions, and then re-subscribe to your site in order to receive notifications. Run step #3 again after to verify you’re actually subscribed. When following the clear site data instructions, please do remember to close all tabs to your site or restart your browser, since Chrome prevents the site’s storage from being accessed until all existing tabs to your site are closed.
- For step #4, do you receive a test notification? If you do, you’re done!
Check the Delivery Page in your OneSignal dashboard
Use chrome://gcm-internals to check message delivery
chrome://gcm-internals.Click the “Start Recording” button on the top left. Making sure you see “Connection State: CONNECTED”.Leave this open and send yourself a push (follow step #4 above to send yourself a test notification).You should see something in the “Receive Message Log” if you got it.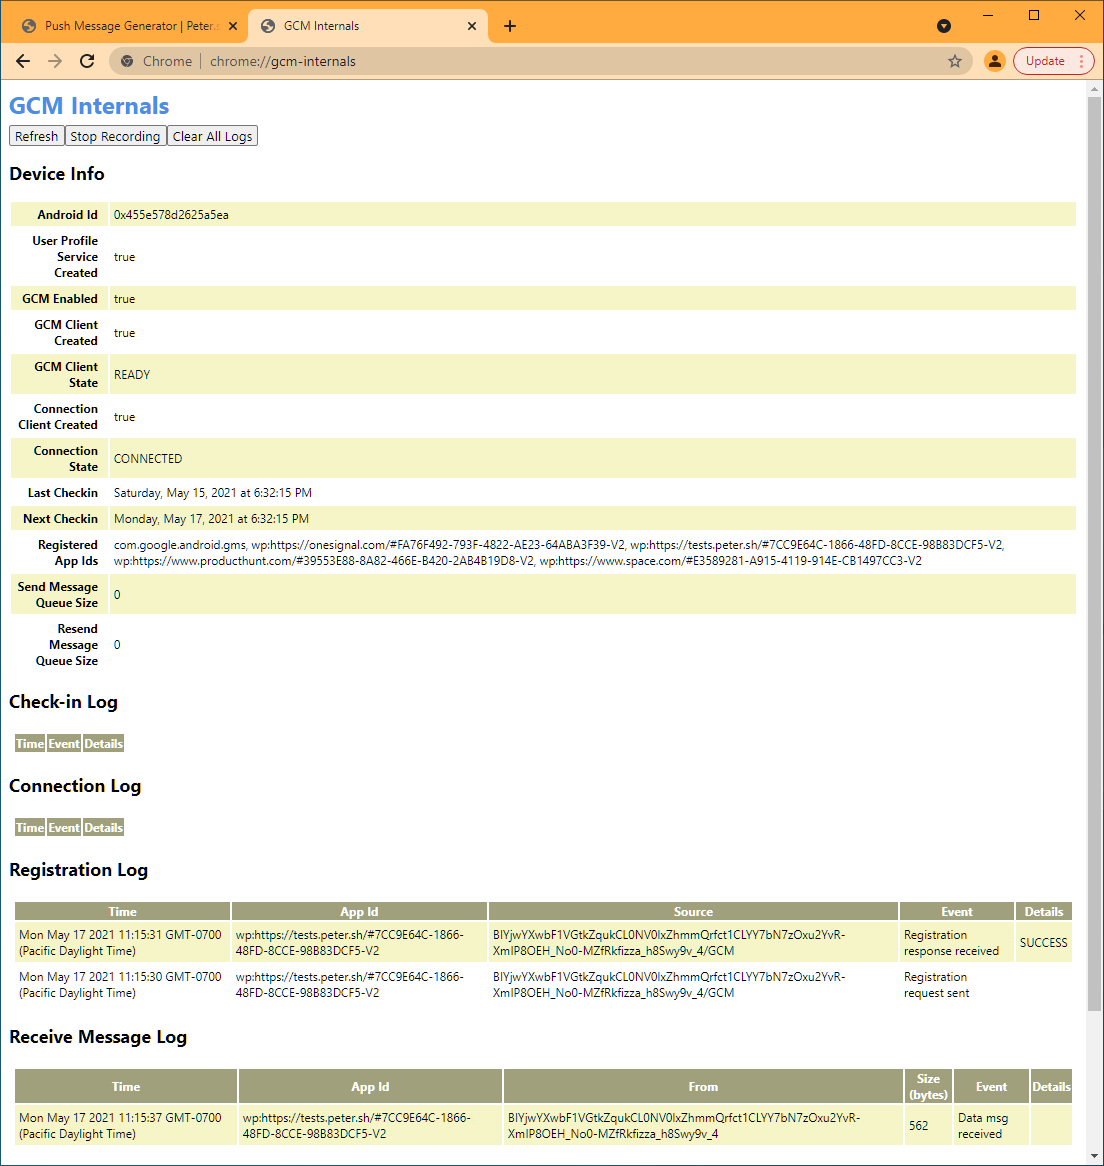
GCM internals logging
- If you don’t see a “Data msg received”, then your Chrome browser is not receiving the notification at all. Please let us know on support about this.
- If you see “Data msg received” but you still didn’t receive a notification, proceed to step #4.
Use chrome://serviceworker-internals to debug service worker
chrome://serviceworker-internals.Search for Scope: https://your-site.com.Click Inspect, or Start -> Inspect, like below. A Chrome Developer Tools popup will appear.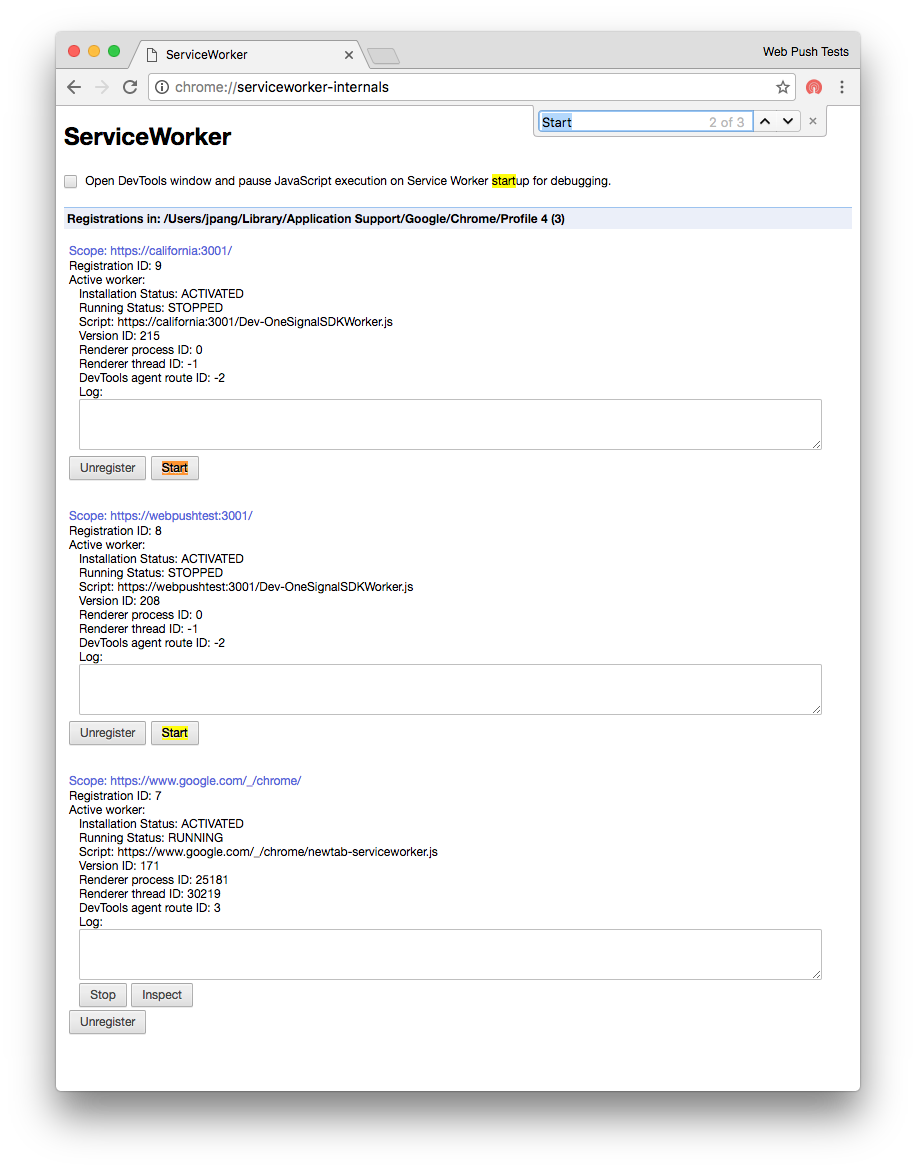
Inspecting the service worker
OneSignalWorker.log.trace();. It should return undefined. Any messages from our service worker should now appear in this pop.Capture console output and contact support
- Right-click inside the Console.
- Select Save as … to export the log file.
- Attach this file and reach out to our chat support for further assistance.
support@onesignal.comPlease include:- Details of the issue you’re experiencing and steps to reproduce if available
- Your OneSignal App ID
- The External ID or Subscription ID if applicable
- The URL to the message you tested in the OneSignal Dashboard if applicable
- Any relevant logs or error messages